Mw 7.7 MYANMAR on March 28th 2025 at 06:20 UTC
Last update: 16 April 2025 at 12:30 UTC
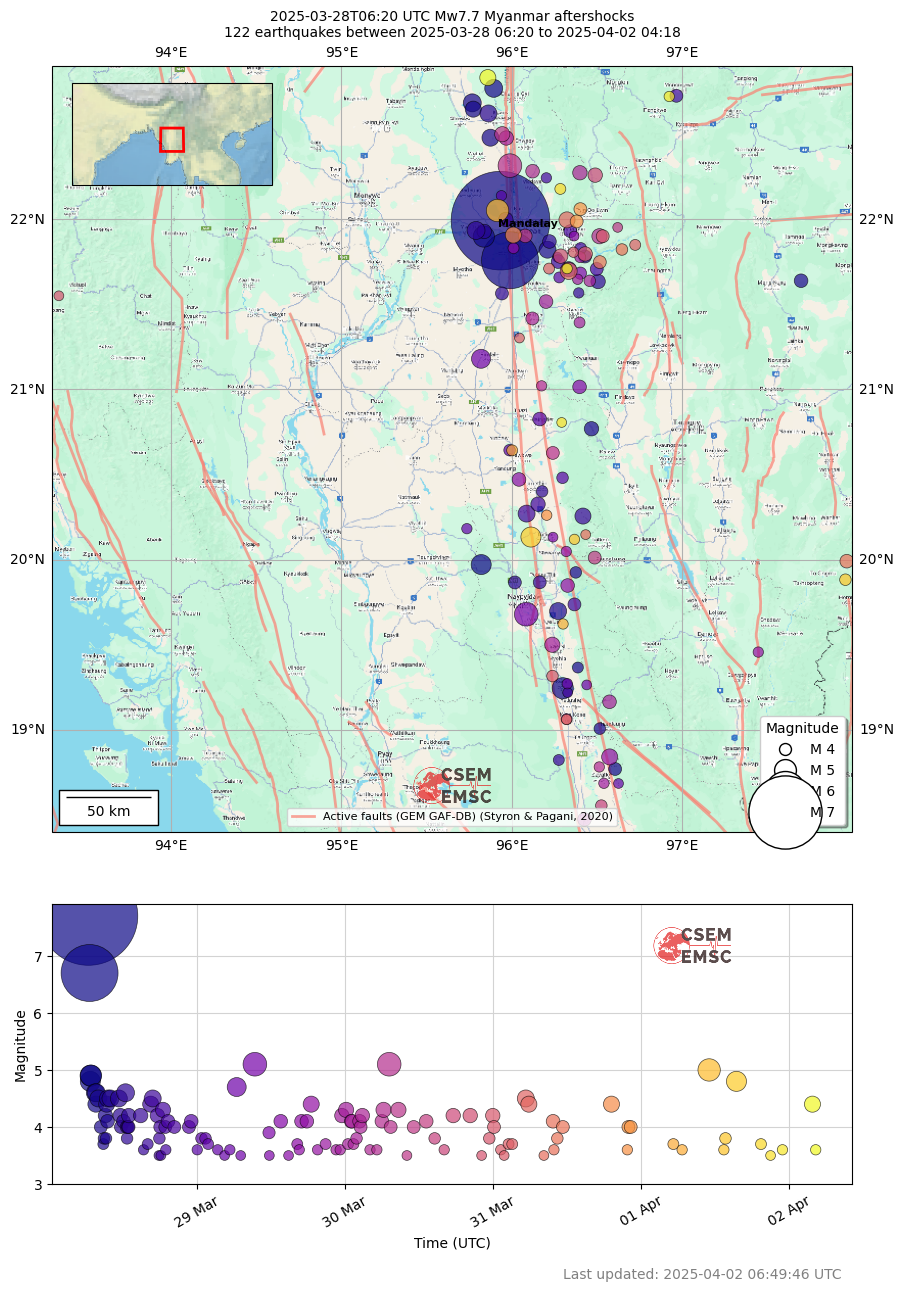
On March 28, 2025 at 06:20 UTC (12:50 local time) an earthquake of magnitude 7.7 struck MYANMAR, 17 km W of Mandalay, Myanmar. Seismological information is available here. The mainshock was followed 12 minutes later by the largest aftershock to date, a magnitude 6.7. Many more are expected in the coming weeks.
This earthquake occurred on the fault between the India and Eurasia plates and was felt up to 2000 km from the epicentre.
At the time of this report, local authorities report that more than 2000 dead and thousands injured. These numbers may vary rapidly in the days following. Especially as several buildings have been damaged and a lot of people are still missing. Our thoughts are with the people of Myanmar
If you felt this earthquake, please share your experience with us. Your testimony will be useful to update the intensity map here below, where the felt intensities represent the effects of the earthquake over the affected area.
 |
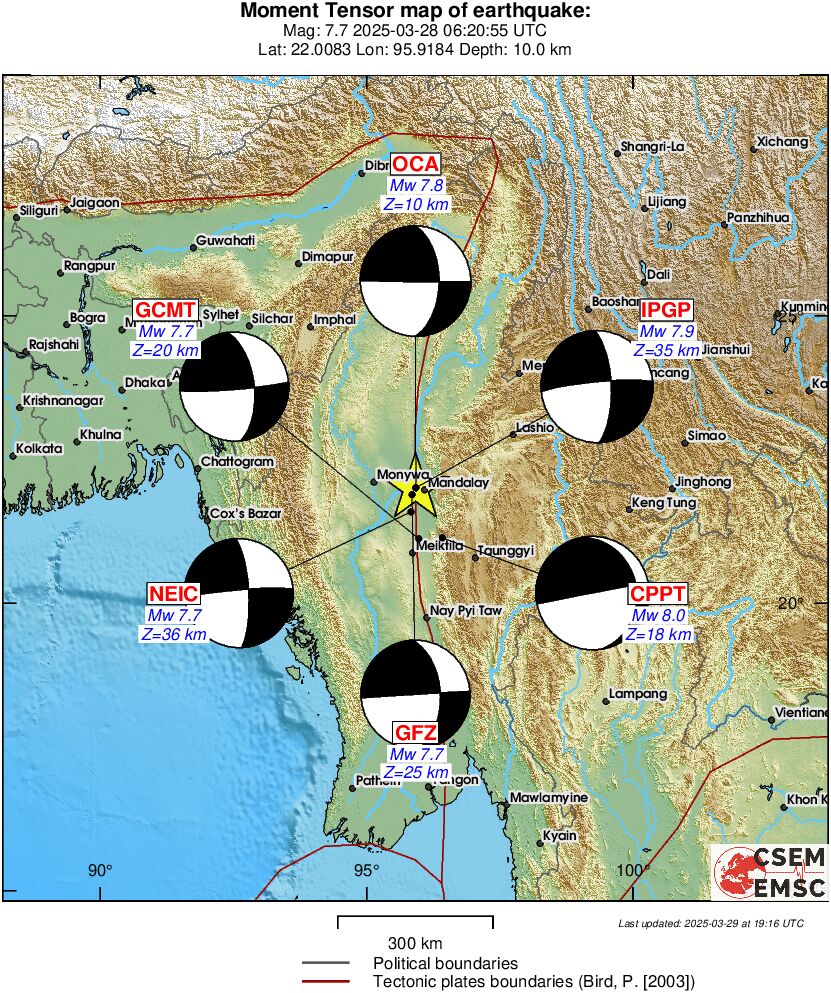 |
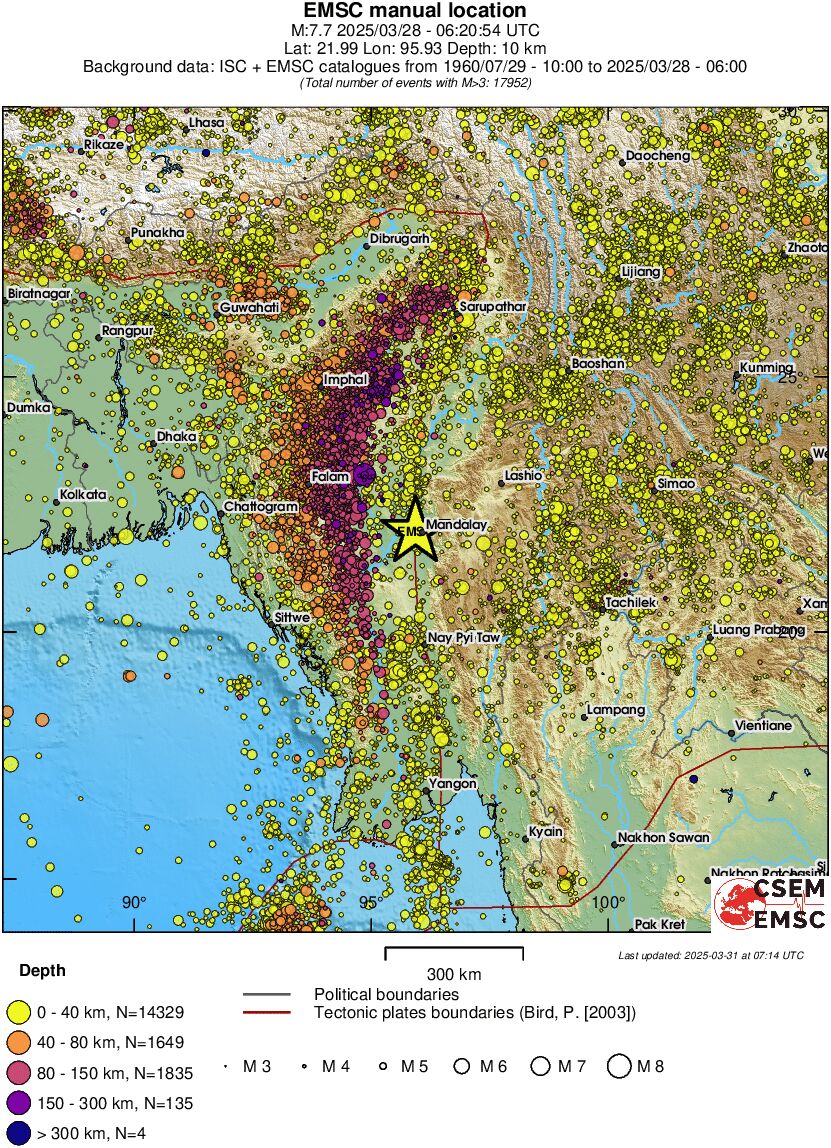
| Past Regional Seismicity as from the ISC catalogue (1964-2004) and EMSC Real Time catalogue (2005-today) | Moment tensors solutions received at EMSC |
After a large earthquake, many smaller earthquakes can occur in the area of the main shock. They are called aftershocks and are caused by the adjustment of the crust to the effects of the main shock. Below is a summary of the recorded aftershocks. It is likely that there will be more in the coming days. If you are in the affected area, please remain cautious.
 |
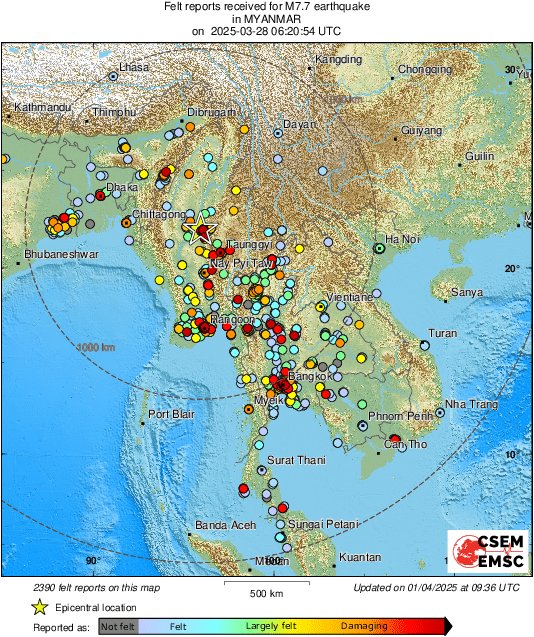
- Map of felt reports
The EMSC collects testimonies from people who felt the earthquake. This information is collected through the LastQake mobile application, mobile or desktop website. The map below shows the testimonies collected by the EMSC for the main shock. Each coloured dot corresponds to a witness observation, which we call a "felt report". The redder the dot, the more intense the earthquake was felt.
By aggregating the reports, we can quickly map the effetcs of the earthquake.
|
|
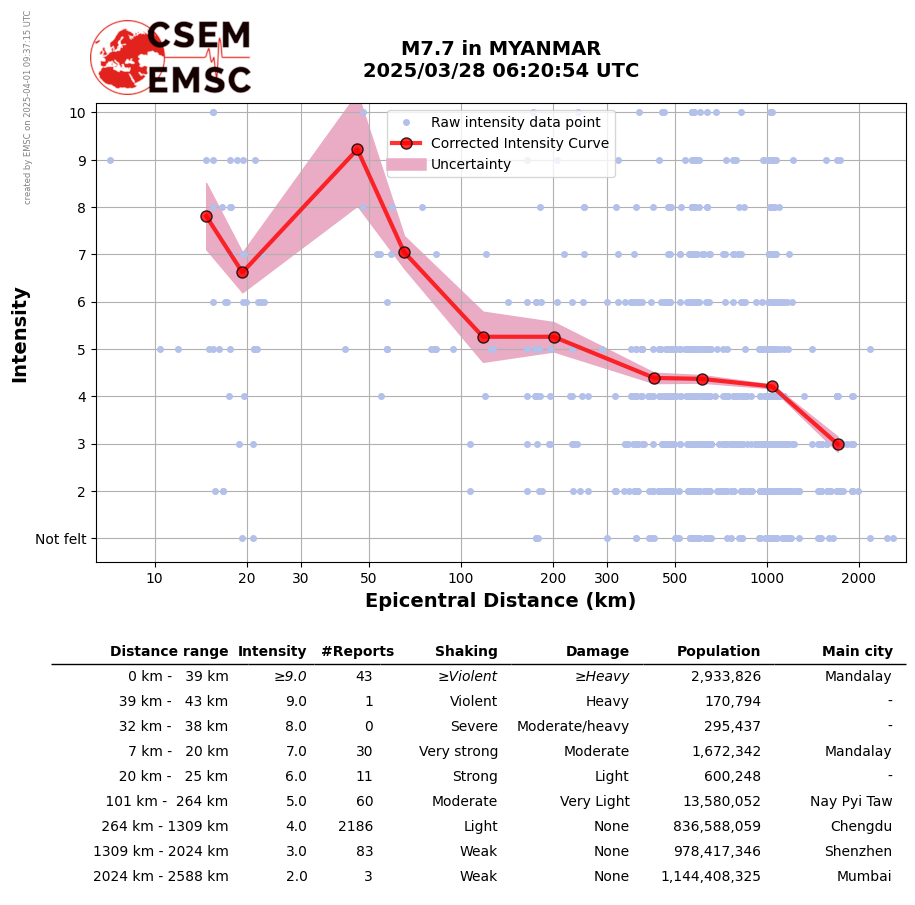
- Curve Intensity / Distance
This graph shows the change in intensity as a function of distance from the epicentre. Intensity ranges from 1 to 12 and measures the observed effects of the earthquake in terms of shaking and damage at a given location. An earthquake is therefore associated with one magnitude and a variety of intensities, depending on where it is observed. For example, we can see that at a distance of 300 km from the epicentre, the average intensity is around 4. Moreover you can notice the general trend that the further you are from the epicenter, the less intensively you feel the earthquake.
 |
The EMSC also collects photos and videos from eyewitnesses. Combined with geolocation, these provide a picture of the situation and damage on the ground.
- Interactive map of pictures and videos